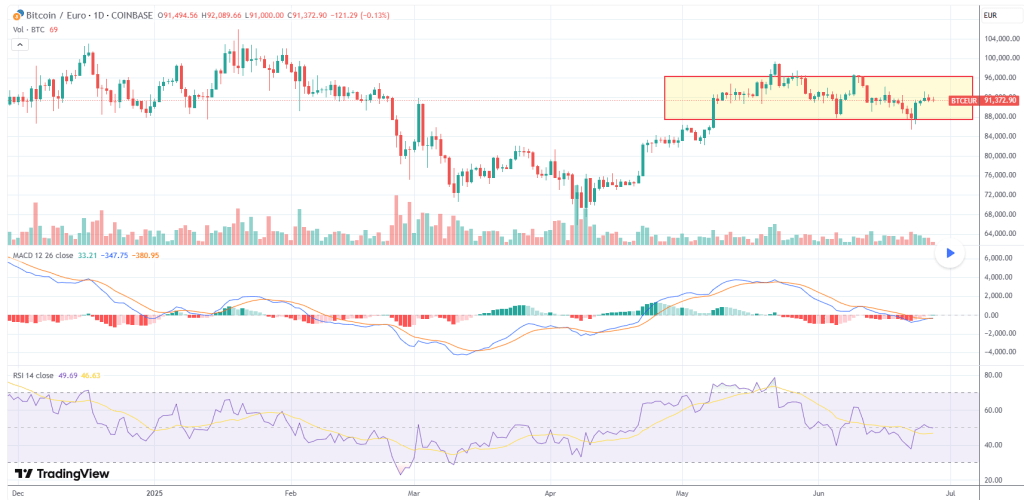

BTC Market Snapshot – Candles Say: No One’s Driving
Lately, BTC’s candles are telling a pretty clear story: no strong conviction either way. We’re seeing small bodies with long upper and lower wicks — spinning tops and near-dojis — which usually means indecision. And it’s happening just below a known resistance zone near EUR92,000, adding to the hesitation.
Take a step back, and the bigger picture still leans bearish. Mid-June gave us a classic bearish engulfing candle right after a short-lived rally — a sign sellers jumped in quickly. Since then, there’s been no real follow-up from the bulls. No hammer, no morning star, nothing that signals serious buying interest. The bounce we saw? Weak. Now price is stalling again.
Bottom line: Price paused, and no one seems willing to take control.
Momentum Feels Off – Trend Losing Juice
The uptrend that carried BTC from April into early June is starting to look worn out. Momentum signals back that up:
MACD still showing a bearish crossover. The histogram’s flattening, not building steam in either direction. RSI is sitting around 46.6 — below the neutral 50 line — and drifting sideways. So far, there’s no panic and no real excitement. It’s that slow, quiet bleed where the market drifts without urgency — classic signs of distribution.
Takeaway: Trend looks tired. This isn’t a strong trending environment — more like sideways chop.
Range-Bound – BTC Stuck in a Trading Box
Since early May, BTC’s been bouncing inside a defined range — roughly EUR88,000 to EUR96,000. Price recently touched the top of the box, got rejected, and now it’s meandering around the lower-middle area. There’s no real volume on either side, which usually means no serious breakout attempts are underway.
Resistance: EUR96,000
Support: EUR88,000
Until something breaks with real conviction and volume, this is just noise inside a box.
Takeaway: We’re still stuck in a range. No breakout, no trend — just ping-ponging.
Key Fibonacci Levels – What to Watch If BTC Moves
Using the swing low around EUR60K and the high near EUR96K, here are the levels to know:
If price breaks lower (retracements):
23.6% → EUR87,504
38.2% → EUR81,344
50.0% → EUR78,000
61.8% → EUR74,656
78.6% → EUR69,984
If it breaks higher (extensions):
100% → EUR96,000
127.2% → EUR106,416
161.8% → EUR118,248
200% → EUR132,000
Current price is floating around EUR91,400 — above shallow retracement levels but well below resistance. In other words, we’re just hanging out in the middle. Not great for direction.
Takeaway: Until EUR96K breaks with real momentum, upside targets stay theoretical.
Trade Setup – Potential Trap Brewing
This setup has all the makings of a range trap. BTC is stuck in a box, bulls are trying to defend the lower third, but there’s no momentum. Bears aren’t attacking either — it’s more of a passive drift down than any strong selling. That’s often when traps form.
Key levels to watch:
Resistance: EUR96K → Needs a solid break with volume.
Support: EUR88K → Below that, EUR81K could come quickly.
Trade trigger: Look for a volume spike paired with MACD or RSI confirmation. Without that, it’s probably just more sideways noise.
TL;DR – Trade Bias and Setup
Bias: Neutral to slightly bearish
Strategy: Sit on your hands for now. Don’t chase price in the middle of the range.
Watch for: Fakes or fades near key levels — EUR96K on the upside or EUR88K on the downside.
Need: A clean breakout, backed by volume and momentum — otherwise, it’s just more chop.
Disclaimer: This text expresses the views of the author as of the date indicated and such views are subject to change without notice. The author has no duty or obligation to update the information contained herein. Further, wherever there is the potential for profit there is also the possibility of loss. Additionally, the present article is being made available for educational purposes only and should not be used for any other purpose. The information contained herein does not constitute and should not be construed as an offering of advisory services or an offer to sell or solicitation to buy any securities or related financial instruments in any jurisdiction. Some information and data contained herein concerning economic trends and performance is based on or derived from information provided by independent third-party sources. The author trusts that the sources from which such information has been obtained are reliable; however, it cannot guarantee the accuracy of such information and has not independently verified the accuracy or completeness of such information or the assumptions on which such information is based.


Leave a comment