
Pacific Bio (PACB) has been dormant for a long time. Now the price action seems to be getting interesting. It deserves a deepdive.
Candlestick analysis
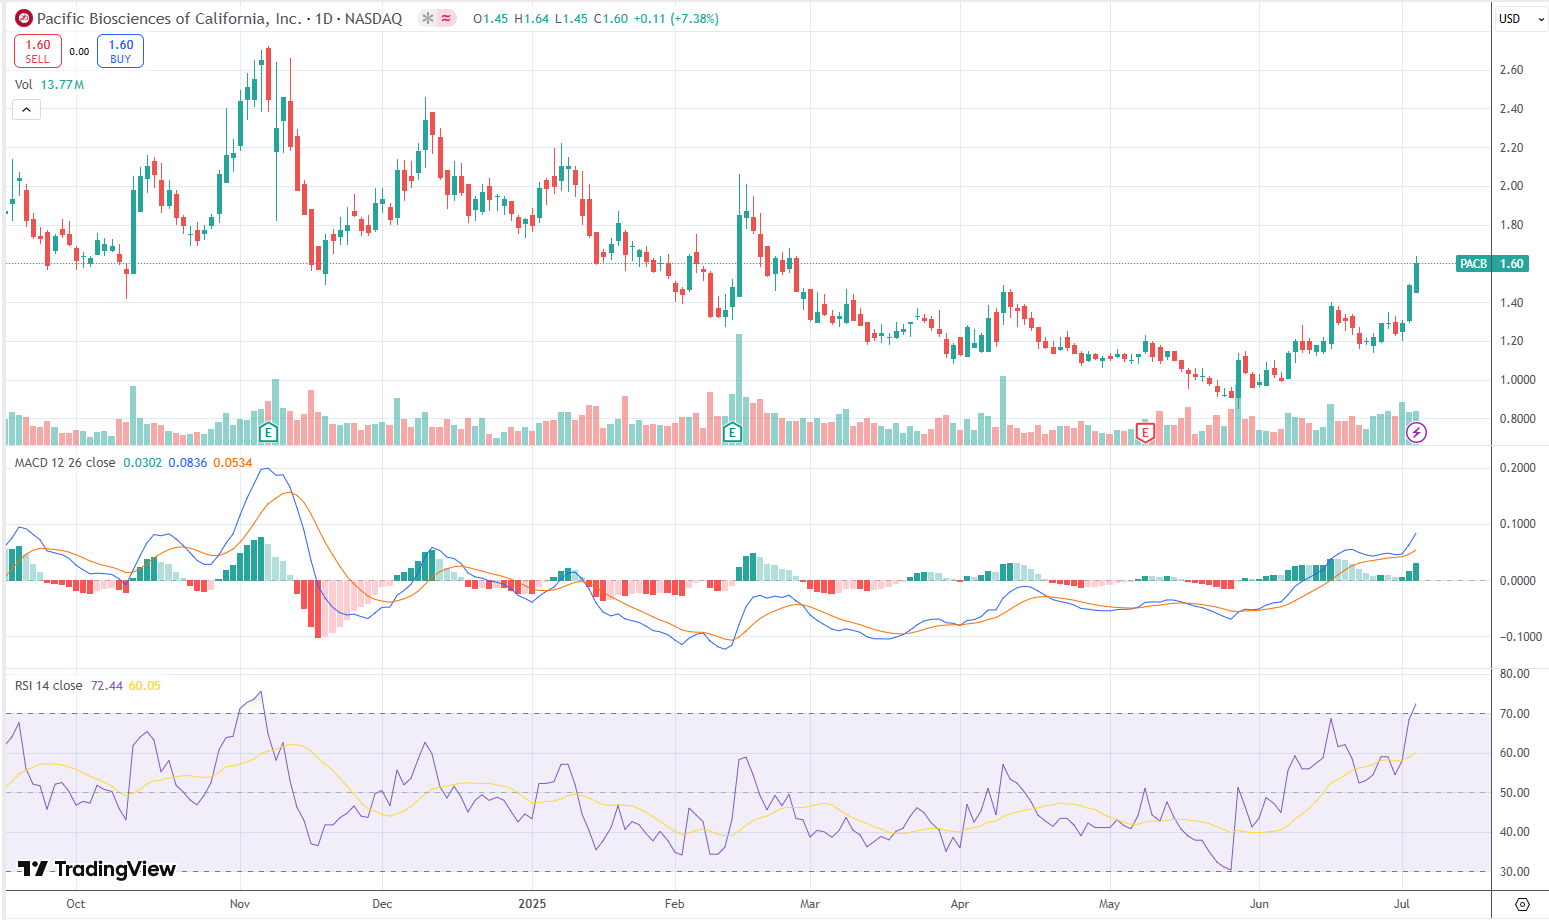
The last three daily candles paint a clear bullish continuation story. Each session closed strong, with large green bodies that finished near their highs and barely any upper wicks—a classic sign of sustained buying pressure. What’s more, volume hasn’t faded; it’s actually picking up, which adds weight to the move and suggests real conviction behind it.
Back in mid-June, price went through a brief consolidation before breaking out with a bullish Marubozu candle—an open near the low and close near the high—exactly the kind of breakout bar that matters. So far, there are no obvious reversal signals either: no shooting stars, no bearish engulfing patterns, and no clusters of doji candles up here. It all points to bulls keeping a firm grip on momentum for now.
Trends and ranges
On the trend side, we’re seeing a fresh sequence of higher highs and higher lows emerging after months of sideways compression. The move is starting to look parabolic, though it still feels like early days in that curve. Momentum indicators back that up too. RSI has pushed into overbought territory at 72.4.
While that usually precedes some sort of pullback, strong trends often stay pinned above 70 for extended runs. Meanwhile, the MACD is firmly positive and still widening which I believe to be a classic signal of early-stage trend acceleration. The sentiment shift is also palpable. It’s moving from apathy toward FOMO territory, so if volume spikes further, expect more emotional price swings.
The prior consolidation carved out a clear range box, and the recent breakout above the ~$1.30 level came with expanding volume—textbook confirmation that this isn’t likely a head fake. If price stalls here, we may see a new range forming between $1.30 and $1.64, but for now, bulls are in the driver’s seat.
Actionable wrap-up
Tactically, the chart screams early markup phase—the accumulation has resolved, the breakout is underway, and the broader crowd is starting to wake up. For those already long, the play is to stay in but tighten risk management. The $1.30–$1.37 breakout zone now flips into support. Any pullbacks into that zone, provided they happen on low selling volume, are solid “buy-the-dip” opportunities.
With RSI over 70, be ready for shallow retracements—something like the 23.6%–38.2% Fib levels between $1.47 and $1.37 would be healthy pauses in the trend. Upside targets to keep in mind: $1.84 (127.2% extension) as a first likely stall point, $2.09 (161.8%) for the next leg if momentum keeps building, and a more ambitious $2.37 (200%) that would probably require a new base to form first. For trailing stops, aggressive traders might set them just below $1.37 (38.2% Fib), while swing traders could tighten up to around $1.47. If $1.37 breaks on heavy volume, that’s your signal it may have been a failed breakout.
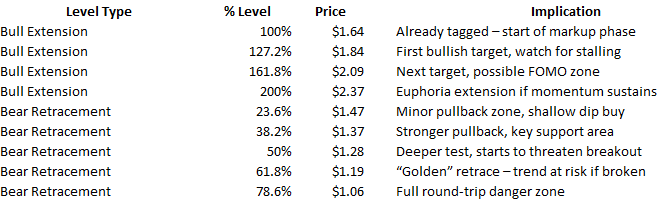
For those still flat, there are two entry options. One is the breakout pullback setup: wait for a dip into the $1.47–$1.37 zone and buy only if price holds with weak selling volume. The other is a momentum entry: jump in on a clean close above $1.64 with accelerating volume, aiming for $1.84–$2.09, but keep stops tight to manage overextension risk.
If you’re thinking about fading this move, be cautious. The MACD, volume, and price structure all suggest bulls are firmly in control. Shorts are likely to get steamrolled unless this move morphs into a blow-off top. Watch for telltale signs of exhaustion like long upper wicks and a massive volume spike near $1.84 or $2.09 before even thinking about positioning against the trend.
Zooming out, this feels like the shift from apathy to hope. Early longs—likely the smarter money—are already sitting on gains and may ride this higher. If price rockets straight into the $1.84–$2.09 zone, watch closely for emotional FOMO-driven surges. That’s where you’ll want to start hunting for cracks in the armor.
Disclaimer: This text expresses the views of the author as of the date indicated and such views are subject to change without notice. The author has no duty or obligation to update the information contained herein. Further, wherever there is the potential for profit there is also the possibility of loss. Additionally, the present article is being made available for educational purposes only and should not be used for any other purpose. The information contained herein does not constitute and should not be construed as an offering of advisory services or an offer to sell or solicitation to buy any securities or related financial instruments in any jurisdiction. Some information and data contained herein concerning economic trends and performance is based on or derived from information provided by independent third-party sources. The author trusts that the sources from which such information has been obtained are reliable; however, it cannot guarantee the accuracy of such information and has not independently verified the accuracy or completeness of such information or the assumptions on which such information is based.


Leave a comment