
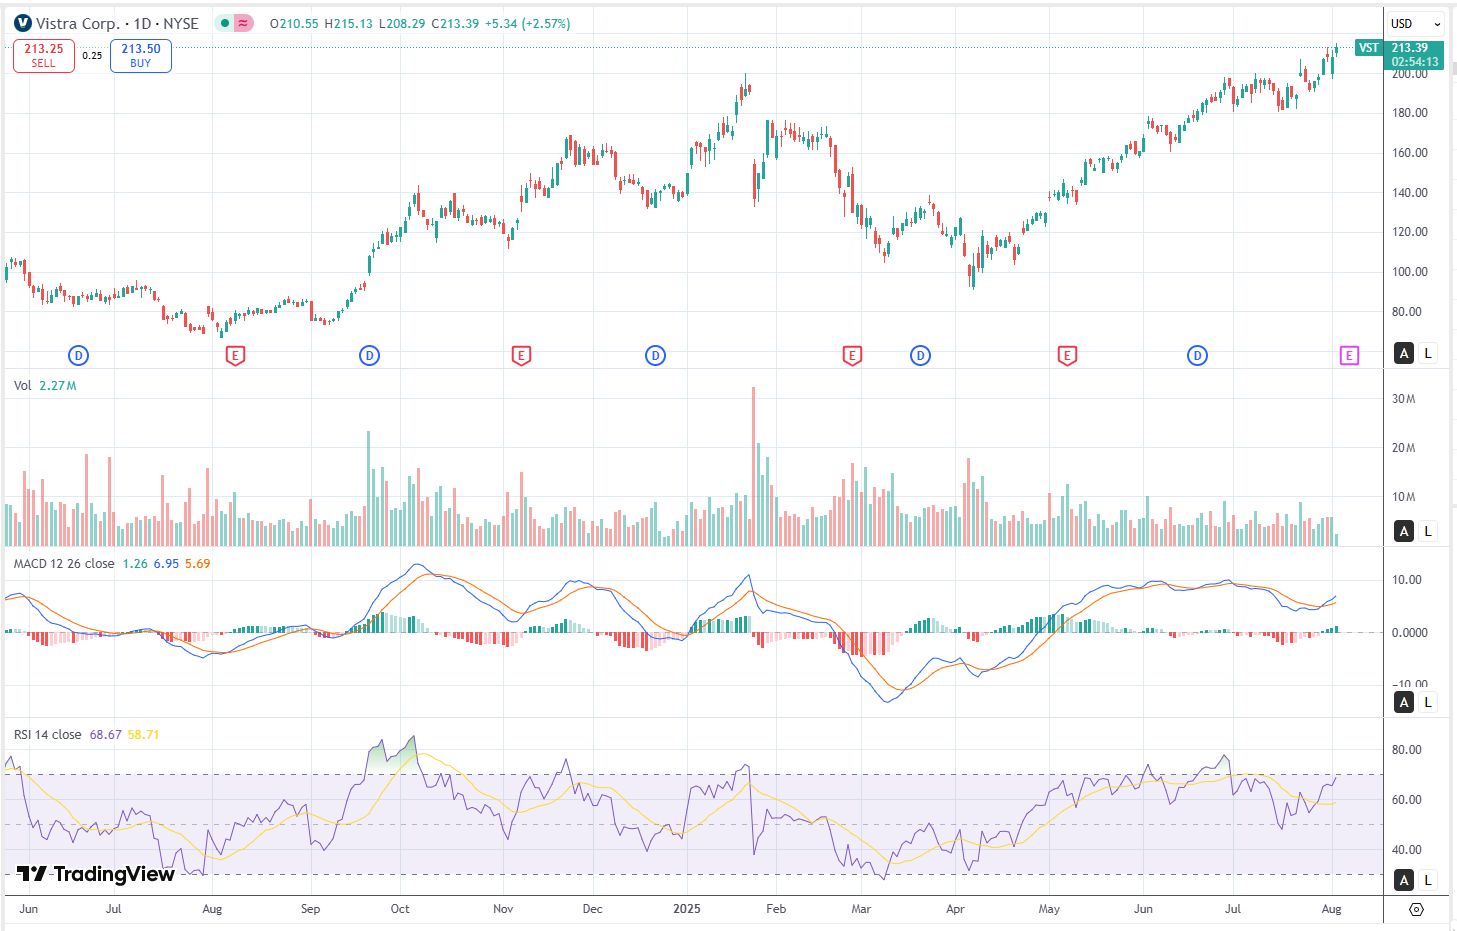
Vistra Corp. (NYSE:VST) has shown renewed strength on the daily chart, with a clear breakout from its recent consolidation range. The technical setup, momentum indicators, and volume behavior all support the case for continued upside in the near term.
Candlestick Analysis: Bullish Continuation in Play
Over the last three trading sessions, VST has posted a series of increasingly strong bullish candles, culminating in a full-bodied marubozu. This pattern, where the stock opens near the low and closes near the high, often reflects decisive buying and strong sentiment.
This follows a brief period of indecision (marked by a doji/spinning top three sessions prior), which now appears to have been resolved in favor of the bulls. There are no visible signs of exhaustion yet , no upper wicks or classic reversal patterns (e.g., shooting star, evening star, or dark cloud cover).
Momentum & Trend: Strength Confirmed
Since mid-April 2025, VST has been in a pronounced uptrend, and the slope of that trend has recently steepened. The MACD is showing a fresh bullish crossover with the MACD line diverging further from the signal line — a sign of renewed upward momentum.
RSI currently sits at 68.67, approaching overbought territory but not yet signaling an imminent pullback. Importantly, there’s no bearish divergence present.
Volume remains supportive of the uptrend. There’s no evidence of capitulation or euphoric buying, suggesting this is more likely institutional accumulation rather than retail-driven hype.
Box Breakout: Confirmation on Volume
From early June through mid-July, VST traded in a defined range between approximately $178 and $202, a classic Box setup. The stock broke out above the $202 resistance level with conviction, supported by a healthy uptick in volume. While not explosive, the volume increase supports the breakout and warrants watching for follow-through in the next session.
This breakout is structurally significant and aligns with the overall bullish continuation thesis.
Fibonacci Levels: Mapping Key Targets
Using the January 2025 swing low of ~$117 and the current swing high of ~$213, the following levels are of interest:
Downside Retracements:
- 23.6% = $192.46
- 38.2% = $180.54
- 50.0% = $165.00
- 61.8% = $149.46
- 78.6% = $128.94
Upside Extensions:
- 100% = $213 (just hit)
- 127.2% = $246.54
- 161.8% = $289.87
- 200% = $333.00
These levels offer potential profit targets or areas to reassess positioning as the trend unfolds.
Tactical Outlook: High-Conviction Setup
The technical setup remains bullish. The breakout from the prior range is clean, momentum is intact, and volume behavior supports a sustained move.
Key levels to watch:
- Support: $213 (former resistance)
- Resistance: $246.54 (Fib 127.2%)
- Invalidation level (stop-loss zone): Below $198
There are no immediate signs of trend exhaustion. Momentum indicators are aligned, and volume behavior suggests this is institutional accumulation rather than speculative chasing.
Trade Considerations
For those already long, continuing to hold or gradually scaling into strength appears reasonable, with a trailing stop below $202. For those not yet positioned, a pullback to retest the $202 breakout level would present a favorable risk-reward entry point.
At this stage, there is no short setup. Any potential reversal would require signs of exhaustion, such as a reversal candle (e.g., shooting star), high-volume rejection, or bearish divergence, none of which are present.
Disclaimer: This text expresses the views of the author as of the date indicated, and such views are subject to change without notice. The author has no duty or obligation to update the information contained herein. Further, wherever there is the potential for profit, there is also the possibility of loss. Additionally, the present article is being made available for educational purposes only and should not be used for any other purpose. The information contained herein does not constitute and should not be construed as an offering of advisory services or an offer to sell or solicitation to buy any securities or related financial instruments in any jurisdiction. Some information and data contained herein concerning economic trends and performance is based on or derived from information provided by independent third-party sources. The author trusts that the sources from which such information has been obtained are reliable; however, it cannot guarantee the accuracy of such information and has not independently verified the accuracy or completeness of such information or the assumptions on which such information is based


Leave a comment