We started our series of blogs “Corning: Boom or Bust” by introducing Corning main activities and businesses.
In the 2nd part we dissected the strategy of the company, and we concluded that in theory it is a winning strategy. Therefore we assume that the revenues of the company will continue to grow, since the way Corning is approaching the market is correct. We also focused on the R&D strategy, analyzing the product and processes development. We concluded that the way the process is structured and the incentives are aligned, is correctly directed to achieve a good execution performance.
In the 3rd part we analyzed the financial statements. We have looked at measures of performance, in order to evaluate Corning’s strategy results. We concluded that the financial performance was in accordance with our standards for success.
In this final 4th part we will create estimations for the income statement and from there we will create stock price estimation for the next 5 years.
So, based on our findings stated in the previous 3 parts, we estimated the following income statement for the next 5 year period:
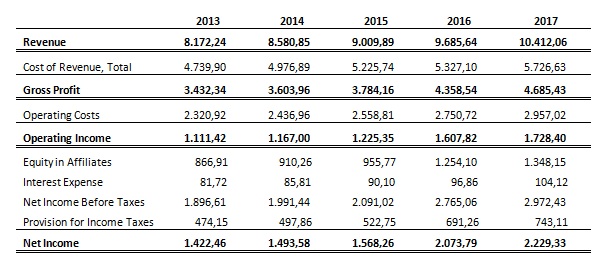
Those are conservative estimations. Our intention is to get a rough measure of intrinsic capacity to generate profits, in order to be able to draw a good estimation for the stock value range.
Based on those estimations we will apply a set of market multiples to the earnings per share (EPS). The rational is simple, market multiples (also known as valuation multiples) reflect the appraisal given by investors to the performance of a given company. If a company has a superb growth perspective, its earnings multiple will be big, however, a company with bad perspectives will have a low earnings multiple. One example of this are companies like Facebook or Google that during the IPO were selling at more than 80 times its earnings.
The Corning’s case is a standard one, the company has moderate to good growth perspectives, with a slight pressure in its profit margins. Right now I would say that for the next 2 years the company will trade at 12 to 14 earnings multiple. After 2015, there might be some improvements which might lead to a range around 16 to 18, somewhere between 2015 and 2017. The results are the following (the return figures are base on a price of USD 15.38)
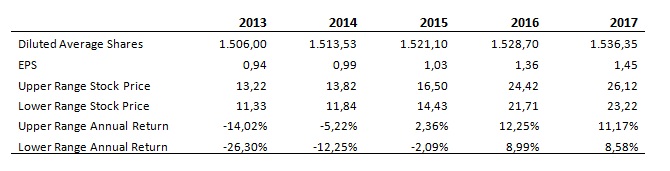
For 2013 we see the value of the company between USD 13.22 and USD 11.33. This corresponds to a return on investment between -14.02% and -26.30%. However if we look 5 years into the future we will see that the company might be worth between USD 26.12 and USD 23.22, corresponding to a return between 11.17% and 8.58% annually compounded. These are not bad results, although I think that in the short term the company is overvalued. Also 11.17% annually is not a bad result, but it does not gives us a good margin for mistakes.
The rational here is simple: If you are more optimistic than I am in relation to Corning’s future, then I think this might be an investment to ponder about, however if you have a less optimist view than the one I presented here probably you will not be interested in investing in this company. This way we concluded our Corning’s Inc valuation exercise.


Leave a comment