Article orginally published on seekingalpha.com
Photo credit: ines s
Summary
- The current market dynamics point towards a crisis.
- The end result should be more monetary easing.
- When the printing press is working, usually, there’s at least one asset that performs very well.
Investment Backdrop
The current market dynamics have become clear, to me, during the last couple of weeks. As I’ve written before, we are going through two main dynamics, that are reinforcing each other. I am referring to the investment glut and the central bank misreading of the monetary backdrop.
Both are self-reinforcing in the sense that the investment glut is driving yields down while keeping the dollar strong, and the monetary misreading is supporting insurance rate cuts that are propping up the stock market.
Graph 1 – Strong dollar
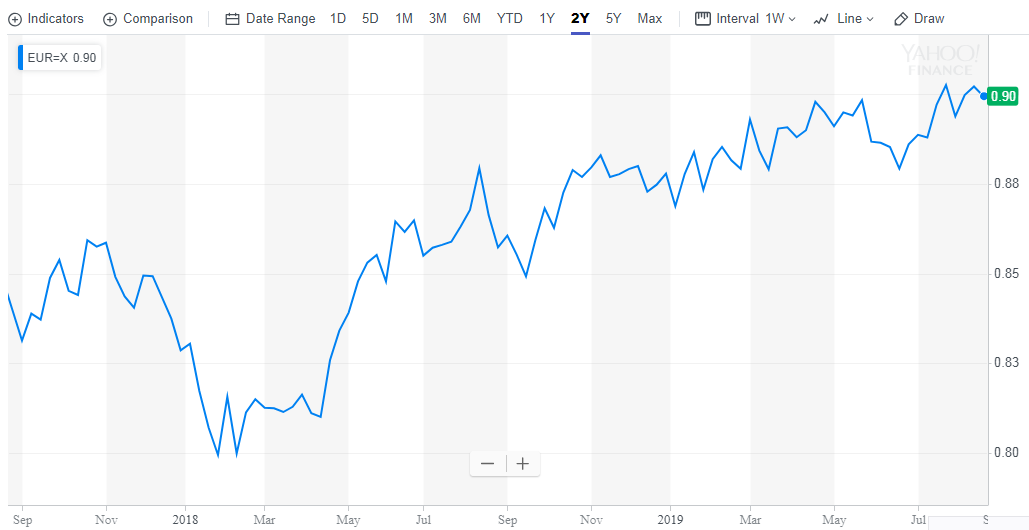
(Source: Yahoo Finance)
Graph 2 – 10-year Yields Down
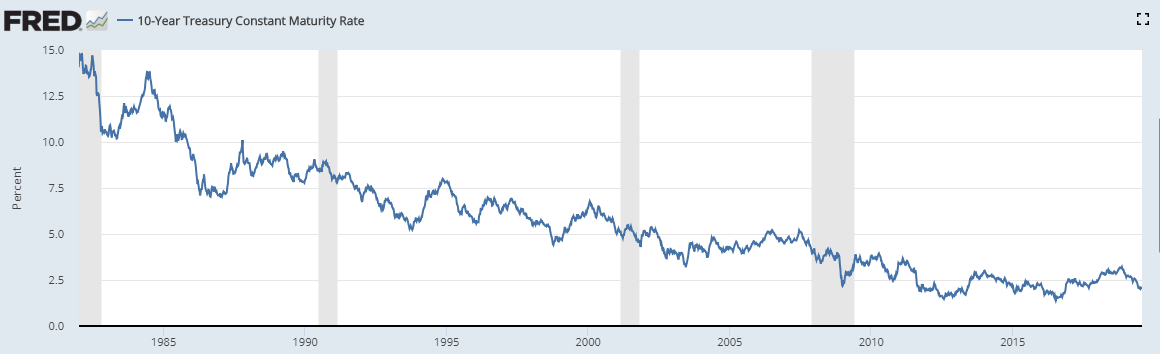
(Source: FRED)
Graph 3 – The S&P is near highs
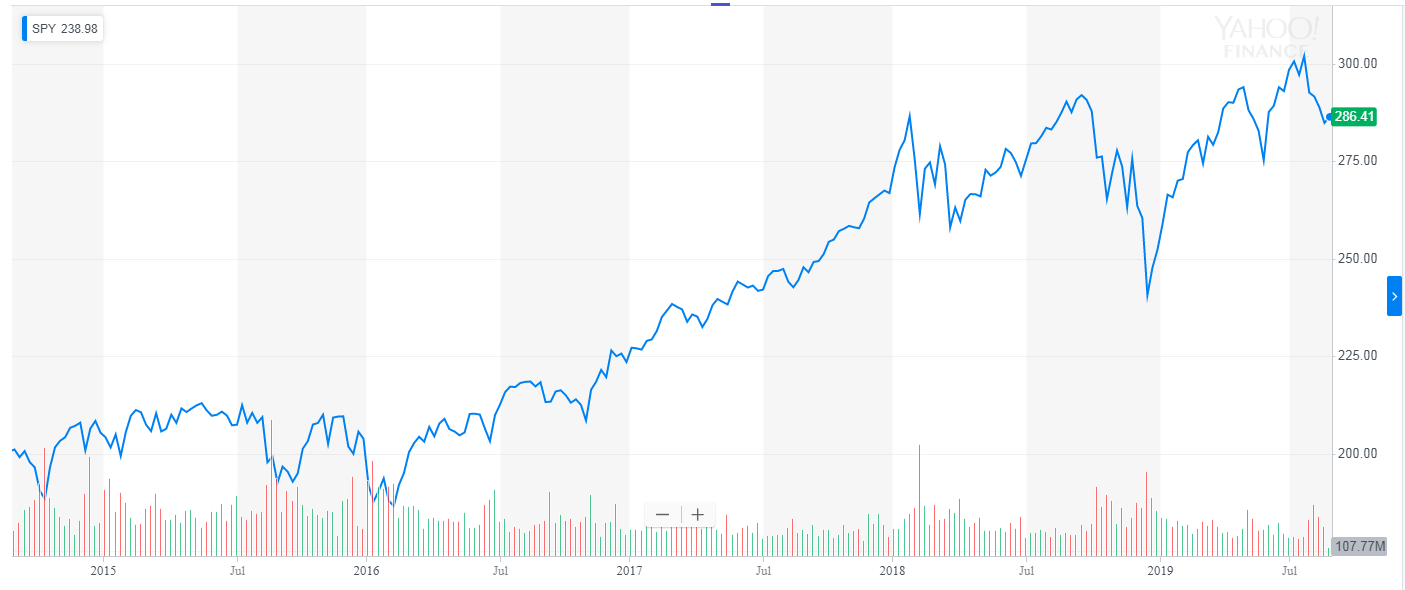
(Source: Yahoo Finance)
The rate cut, and, let’s not forget it, the QT pause, will likely help the stock market getting to new highs. The low yields will also have a self-reinforcing effect. On the demand side, companies should keep borrowing. Part of it will be used to repurchase stocks, at a time that the market is near all-time highs. On the supply side, institutions will eagerly search for alternative allocation that provides better yield. One good example is the corporate credit market.
Therefore, at this stage, we should expect a lot of bad investment decisions, being made. If it weren’t for the trade war escalation, we would already be in the last stage of a massive bubble in both equities and bonds. However, sooner or later, the trade war escalation will contribute to lower yields, feeding the bond and dollar bubble, which will likely spill over to the stock market.
If history is any guide to the future, this folly should end in a massive asset dissipation, following a credit contraction. When that day arrives, Central banks will have to ease even more.
How to position a portfolio against asset dissipation?
Gold (GLD) is seen, by the investment community, or even by society’s common sense, as a great hedge for uncertain times. However, the reason why this happens is not entirely understood. People tend to see gold as a safe-haven. Something that never loses its value, and however, that has not been the case during several periods in the past.
Gold during the subprime crisis
One can argue that the subprime crisis started in August 2007 with a LIBOR spread spike.
Graph 1 – 3-Month LIBOR OIS Spread (Sep 06 to Mar 08)
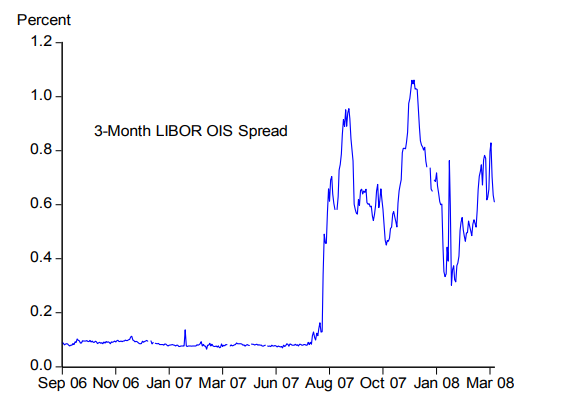
(Source: frbsf.org)
In an attempt to normalize liquidity in the interbank loan market, the Fed reduced interest rates and used several mechanisms to provide liquidity. The immediate reaction in the Gold market was to rise.
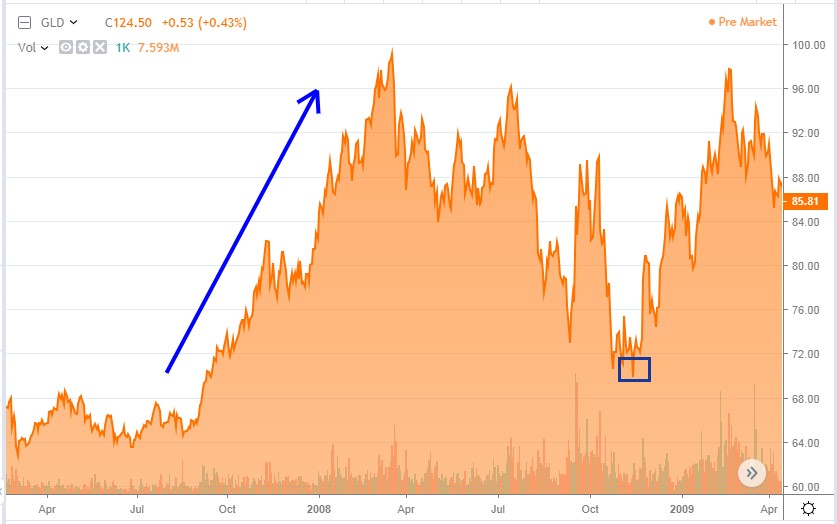
Graph 2 – SPDR GLD price performance during 2007-2008
(Source: seekingalpha.com)
Most people read that as a flight to safety movement. However, we might as well see it as a supply and demand rebalancing. As the Fed was decreasing interest rates and introducing liquidity, gold was now becoming scarcer relative to the monetary mass, thus appreciating.
As we reached the beginning of 2008, and traders started assessing the possibility of normalization in monetary policy, gold started sliding until October 2008. In the process, it gave back most of its prior gains.
Then in September, Lehman Brothers filed for Chapter 11 bankruptcy protection. However, if we look at Graph 2, we can see that this time there wasn’t an immediate flight to safety, which was the expected course of action. Only in November did the price of gold leave the 2008 lows. The next graph might help in explaining that phenomenon.
Graph 3 – Fed holdings of Treasury and Mortgage-Backed securities
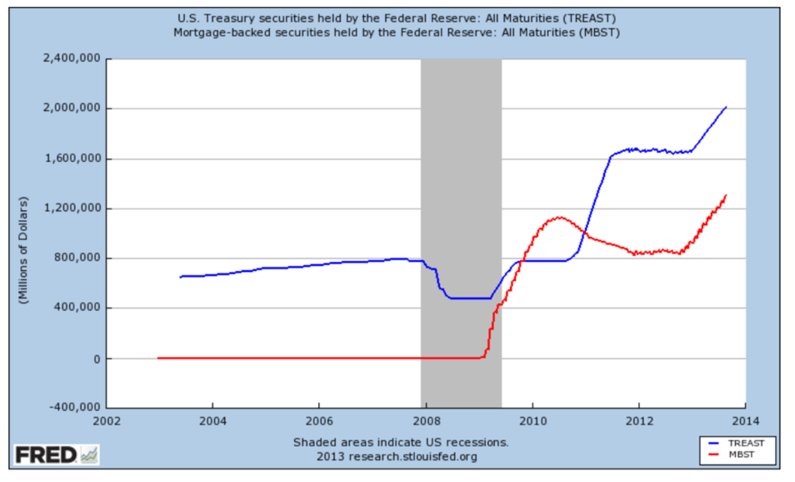
(source: FRED)
The Lehman’s bankruptcy brought renewed liquidity problems, meaning that the Fed needed to react. The Agency Mortgage-Backed Securities (MBS) purchase program, worth 600 billion, and the Term Asset-Backed Securities Loan Facility (TALF), just to mention some, represented a significant increase in monetary mass. In my opinion, that was the real trigger for the gold price. From that moment on, the gold price just kept climbing, until 2011.
Graph 4 – SPDR GLD price (Sep 08 to Sep 11)

(Source: seekingalpha.com)
Investment rationale for gold
The facts described, in the previous paragraphs, do seem to suggest that gold performance is well correlated with troubled times. However, gold takes its value from the fact that it is a scarce commodity, whose supply, in the short-term, is very hard to increase. There are other factors, like being a traditional safe-haven, that also play some role in increasing demand. However, it seems to me that the most important factor lies in the monetary easing that tends to accompany uncertainty and crisis.
Therefore, there will be other commodities and currencies that will exhibit similar behavior and function well as stores of value. Gold is just the most mediatic of the bunch (also there is no central bank responsible for its issuance). On the other hand, in the absence of money printing, gold might not perform well, even during troubled times. Finally, in the long term, gold supply plays a role, as we saw in 2011. If the price goes up enough to create a gold fever, producers will start looking for new sources of gold, and the market will end up oversupplied.
As the money in circulation rises, the most conscious people will go after assets that remain supply-constrained. Gold tends to be among those. That explains why sometimes gold goes down after uncertainty inducing events. On the other hand, it tends to react to money printing.
The bust will materialize, sooner or later. I have previously formulated one thesis for it, and only time will tell how far-off it was. However, we all can be pretty sure that some form of money (MMT seems the next one) printing will follow. In that type of scenario, gold seems poised to boom.
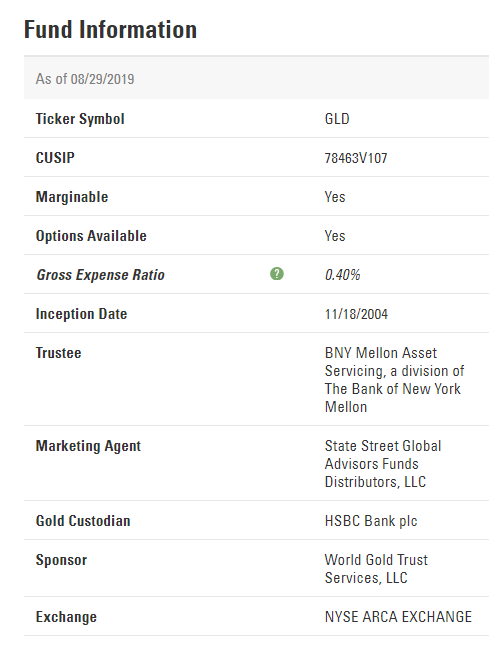
The simplest, and perhaps, most efficient way of gaining exposure to gold is through an exchange-traded fund (ETF) that replicates the price of gold. One of the most notorious is the SPDR Gold Shares (GLD). Its main goal is to reflect the performance of the price of gold bullion, less the expenses of the fund’s operations. For that purpose, it mainly holds gold. The gross expense ratio is 0.4%, which is low enough.
Basically, this is a low-cost and very efficient way to take advantage of the scenarios outlined in the previous paragraphs.
Disclosure: I am/we are long GLD. I wrote this article myself, and it expresses my own opinions. I am not receiving compensation for it. I have no business relationship with any company whose stock is mentioned in this article.
Additional disclosure: This text expresses the views of the author as of the date indicated and such views are subject to change without notice. The author has no duty or obligation to update the information contained herein. Further, wherever there is the potential for profit there is also the possibility of loss. Additionally, the present article is being made available for educational purposes only and should not be used for any other purpose. The information contained herein does not constitute and should not be construed as an offering of advisory services or an offer to sell or solicitation to buy any securities or related financial instruments in any jurisdiction. Some information and data contained herein concerning economic trends and performance is based on or derived from information provided by independent third-party sources. The author trusts that the sources from which such information has been obtained are reliable; however, it cannot guarantee the accuracy of such information and has not independently verified the accuracy or completeness of such information or the assumptions on which such information is based.


Leave a comment