
Summary
- Assessing the duration of the lockdown is the real key to understand the impact on the economy.
- Industries a with high proportion of fixed costs will be more vulnerable to a long stint.
- We assess the possible impact of the lockdown on US automakers.
Make no mistake. The current crisis will be life-threatening to several companies, including some big ones. For obvious reasons, the big auto producers are part of the lot. These companies have a big proportion of fixed costs, and that means they can’t scale down easily. Additionally, years of poor performance, or lack of financial prudence, have never allowed them to replenish their balance sheets. Therefore, it makes all the sense to evaluate which companies will be life threatened, and which won’t.

(Source: EveryCarListed P)
Building a Macro base case for the COVID-19 impact
One way to build a base case is by looking into the past and select a period of similar conditions. As it happens many times, you can’t always find a completely similar past situation. Therefore, you have to make assumptions, and sometimes, your assumptions are going to be way off-track. So, forgive me in advance for all the times that you’ll feel offended by my reasoning. With this exercise, we intend to provide good to provide some clues, but not to completely predict the future.
Getting back to our base case the current situation is very similar to the Spanish flu outbreak of 1918. Back in 2007, Thomas A. Garrett, Assistant VP at the Federal Reserve Bank of St. Louis, wrote a piece called Economic Effects of the 1918 Influenza Pandemic. It’s worth reading, the similarity with the present situation is striking, and I believe it will provide good clues.
Since the situation is very similar, let’s use some of the data. The problem is that there isn’t much data from 1918. Then, let’s use a more recent pandemic with this global impact. Well, the last century was kind, and we never really had anything similar in scale (I’m no epidemiologist, so if you know one with similar characteristics, please, tell me). All that to say that we will have to use the Spanish flu has our benchmark for what comes next.
The Spanish flu developed in three main waves. Scientists believe that it started in the US, then, it was carried to Europe by soldiers, and finally, carried back to the US when the war was over. I believe that we are living the same cycle again, but this time the spread of the disease was facilitated by business globalization. Given the high degree of integration of the world, the spread was very fast. My thesis is that we might be going through the second wave, first China, second Europe, and the US. Therefore, we might have a resurgence next winter. Again I’m no expert. These are just working hypotheses that I’m putting on the table.
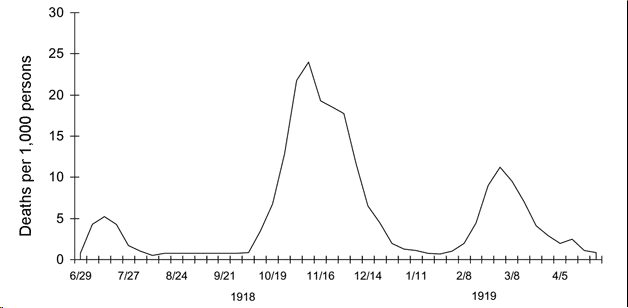
(Source: Wikipedia)
In the graph, we can see that the biggest wave lasted from October until December of 1918, roughly three months. That is similar to the Chinese experience. The Hubei lockdown started on the 24th of January, and authorities started to ease it on the 18th of March. Without better knowledge, I’ll use two months as a reference for how long the lockdown will last.
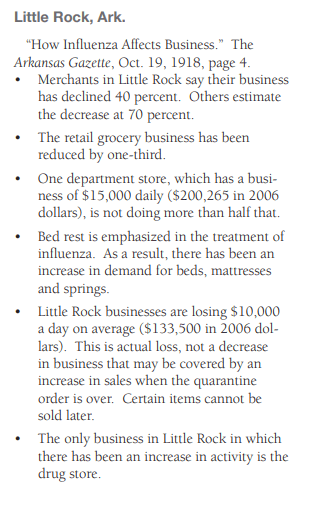
Now, to understand the business impact, we’ll go back to the Economic Effects of the 1918 Influenza Pandemic. This work doesn’t add much in terms of economic figures. However, it collected samples of articles from that time which might offer good clues to the impact:
(Source: stlouisfed.org)
We are talking about double-digit losses in many cases, some as high as 70%. As I’ve stressed out before here and here, this will result in an economic event that will reduce cash-flows and impair the ability to meet current debts.
Summing up, our base case is defined. We will use two months lockdown, where factories don’t work, and then, we’ll use a high double-digit sales drop. After the first two months, we will start the normalization. For the sake of simplicity, we won’t consider a new wave of the virus next winter, but that is a real risk.
Stress testing Ford
Car manufacturers tend to have a high portion of fixed costs. Our goal is to get a picture of how the lower revenues might affect the bottom line, the cash-flow, and, ultimately, the cash at the end of 2020. Now, this is a very complex task, and to model it, we will have to ignore many variables that we believe to be less relevant. Those variables might reveal to be material in a couple of months, but again our goal is just to provide some goalposts, not to make detailed predictions of the future.
Using our initial assessment of the pandemic, we’ve defined the following Ford’s (F) sales scenario. We are assuming that Q2 will be hard hit, then it will recover in Q3, and it will reach a normalized plateau at 90% of last year’s sales.
Table 1 – Ford’s quarterly revenues 2020 estimation (in millions of USD)
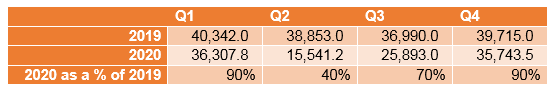
(Source: Author’s calculations)
Now, turning to the cost of sales, it is very hard to separate the fixed from the variable costs, but we gave it a try. In this case, we’ve defined that the company will have around 37% of fixed costs and 63% variable, and we’ve adjusted the gross margin accordingly. We’ve based our assumption in analysis, like the one below.
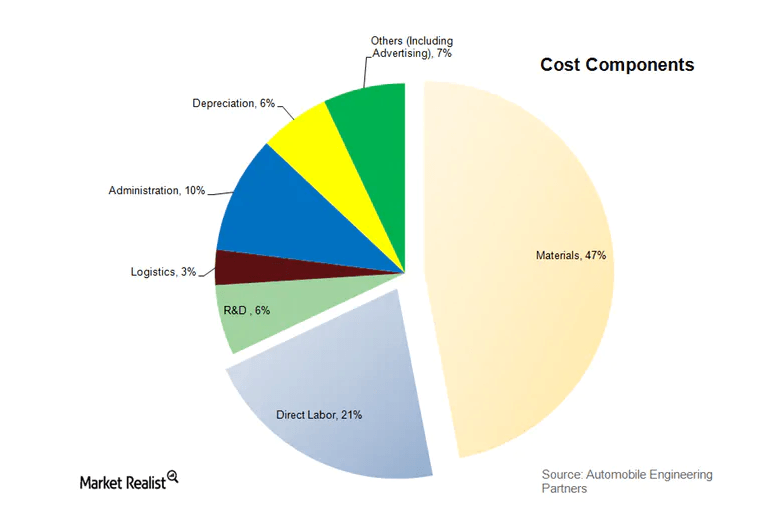
(Source: marketrealist.com)
On the SG&A front, we are assuming that the company might reduce it by 20%. I know this is a bit arbitrary, but not farfetched. The costs allocated to Ford Credit should vary with the revenues. Interest expenses should rise due to the utilization of the additional loan lines. Finally, I assume a 20% income tax rate, which will hardly be correct, but it will reflect lower income taxes paid.
Table 2 – Ford income statement estimation for 2020
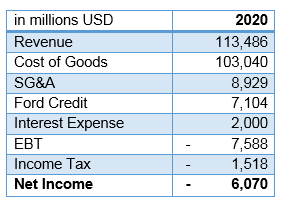
(Source: Author’s calculations)
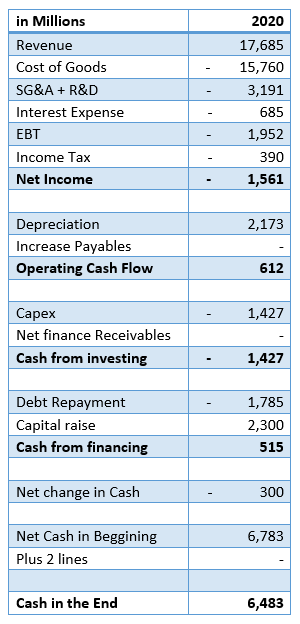
To calculate the cash-flow and cash position at the end of the period, we’ve considered the depreciation similar to 2019’s figures. In the past, Ford increased in accounts payable (and other deferred liabilities) in the order of $5 billion a year, however, I’ve ignored it because I’m not sure that it could be maintained. Capex was reduced by 30%. The net effect of finance receivables and operating leases is maintained close to its current levels. On the debt repayment front, the company has to pay around $1,5 billion during 2020. Finally, if we add the two credit lines that Ford used last week, we have the following:
Table 3 – Ford cash-flows and liquidity for 2020
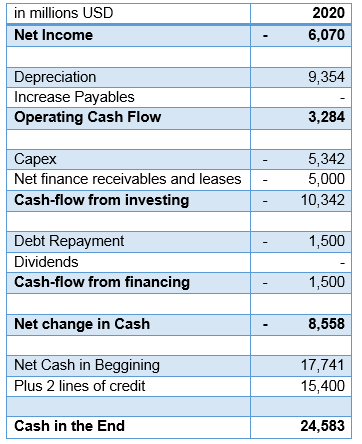
(Source: Author’s calculations)
In this scenario, Ford is burning through a lot of cash, but it seems that, if 2021 is a normal year, the company will likely survive. I want to stress one more time that this should be seen as a simplification of a very complex reality, and it likely contains significant mistakes. One way to look at the results is that the model has around $24 billion of margin for error. The error might come from the wrong specification, or the reality materializing very differently from the assumptions. In either case, it is a wide margin, but by no means infallible.
In my opinion, the $24 billion cash seems to offer some assurance about Ford, as a going concern. But, let’s stress test it a bit further. Assume a longer production stop.
Table 4 – Ford quarterly revenues pessimistic scenario (in millions of USD)
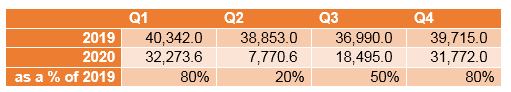
(Source: Author’s calculations)
That would burn through another $7.5 billion, leaving the final cash at $17 billion. The company can still survive, but at this stage, we would have to wonder if the confidence wouldn’t be so affected that it made future debt refinancing close to impossible.
All-in-all, Ford’s position is far from secure, but it seems strong enough to weather a short-term disturbance like the one right now. However, it is important to understand that even if the company makes it, the economic structures might face permanent dislocation. For instance, it is arguable that the SUV fever that helped carmakers’ profits will be over. Then, we might see the return of a tendency towards cheaper models. The adaption speed of the carmakers to the changing market will determine the survival chances in the years after the crisis.
Stress testing General Motors
I’ve made the same analysis for General Motors (GM) broadly using the same assumptions, but there are always accounting and business specifics to each company. The main difference is on equity income. I chose to zero this item because likely that income won’t repeat this year. I’ve also made a discretionary cash-flow adjustment related to changes in asset values that are recurrent in the company’s financials. Finally, I’ve added $1.9 billion in debt repayments in 2020, and the remaining lines of credit ($17.3 billion not used).
Table 5 – GM income statement, cash flows, and liquidity estimation for 2020 (in millions of USD)
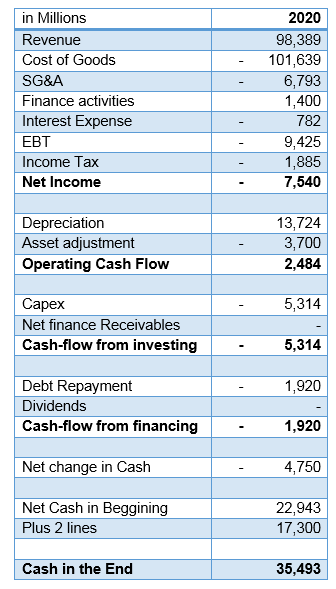
(Source: Author’s calculations)
GM seems in a better position than Ford. It still has unused credit lines, and it’s burning through less cash than Ford. Using the bad scenario for sales here, GM would still have close to $30 billion in cash. So, there’s a lot of room for error here.
Stress testing Tesla
Finally, let us take a look at Tesla (TSLA). This company has the added problem of also having a solar business unit. Nevertheless, we applied the same principles since both are high fixed-cost operations. The biggest change, to the other companies, is that I’ve kept the Capex at the same level as last year. That’s because, last year, Tesla had already tightened its capital expenditures, and I don’t think they could go much further.
Table 6 – Tesla income statement, cash flows, and liquidity estimation for 2020 (in millions of USD)
(Source: Author’s calculations)
The result is pretty good. The company burns almost no cash. In hindsight, the timing of the capital raise was brilliant. In our bad scenario, the company burns through $1.5 billion in cash, ending the year with $5 billion. Still decent.
Wrapping-up
This is a top-down analysis aimed at defining a realistic scenario, with concrete impacts at the operating level of the companies, and then, stress-test them to see how they might fare. Obviously, there are many intricacies to the accounting apparatus behind the financial statement of these companies. Therefore, I’ve tried to select the most important ones, and capture its variability given the changing conditions. It may so happen that time will show us that I’ve failed miserably at doing so. My apologies in advance. However, looking at the results makes me think that all will not have been in vain.
For starters, it gives us an idea about the way these companies’ operations might be affected. The next quarterly report will show us where we might be far off, but, at least, it will give us goalposts to use as a reference. For instance, If the companies have better sales, but burn through more cash, we might realize that the situation is worse than thought, and vice versa.
Now, turning to the actual results. I think that Ford went to this crisis underfunded. They should have more liquidity. In my opinion, their cash target of having $20 billion in cash, and $30 billion liquidity, is not enough when facing a black swan-like this. Under the scenarios discussed, I don’t think they’ll go under, but they could have reduced the risk. Now it is too late. They’ll have to bite the bullet with what they have.
On the other hand, GM and Tesla seem fine and capable of weathering this one. However, a word of caution is necessary. If their production pause goes for much longer than we’ve seen, all these companies might be at risk. Additionally, the virus might fade and then come back with a vengeance next winter.
On another front, likely, there will be a rise in unemployment and a loss in disposable income. People might revert from expensive SUV back to cheap economic cars. Who knows what the new trends will be? But, one thing is guaranteed. This crisis will change consumer behaviors, and the industry will have to adapt fast.
However, I won’t count any of these companies out, especially Ford. The jury is still out on the global impact this will have on other auto companies. Some might go out of business, and some might become available for consolidation. Additionally, at the height of the crisis, the companies perceived has weakest will be beaten down. If they can make it, it will pay off handsomely. I’m not saying it will, but it has happened before.
(Souce: Seeking Alpha)
To put it to rest, many readers will find holes in this analysis. I welcome that criticism if put constructively. Bring it to the commenting section and contrast your analysis with mine. For instance, if you think I’m too optimistic concerning revenues tell me how much you want, and, I’ll try to run it in the model and drop a comment with the results.
Disclosure: I am/we are long F.
I wrote this article myself, and it expresses my own opinions. I am not receiving compensation for it (other than from Seeking Alpha). I have no business relationship with any company whose stock is mentioned in this article.
Additional disclosure: This text expresses the views of the author as of the date indicated and such views are subject to change without notice. The author has no duty or obligation to update the information contained herein. Further, wherever there is the potential for profit there is also the possibility of loss. Additionally, the present article is being made available for educational purposes only and should not be used for any other purpose. The information contained herein does not constitute and should not be construed as an offering of advisory services or an offer to sell or solicitation to buy any securities or related financial instruments in any jurisdiction. Some information and data contained herein concerning economic trends and performance is based on or derived from information provided by independent third-party sources. The author trusts that the sources from which such information has been obtained are reliable; however, it cannot guarantee the accuracy of such information and has not independently verified the accuracy or completeness of such information or the assumptions on which such information is based.


Leave a comment